FAN Wen-long, LI Gui-rong, YAO Yuan, TANG Ming-shuai, ZHU Jie, Sulitan Yusan, LI Rui, TAN Cui
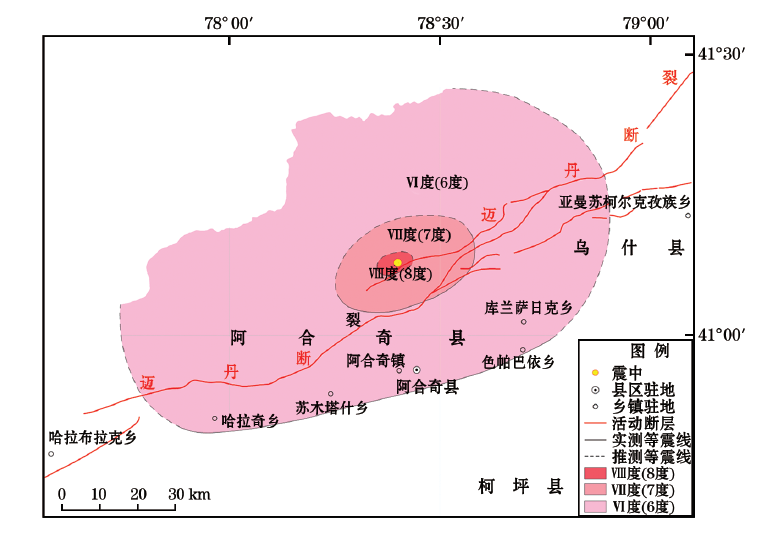
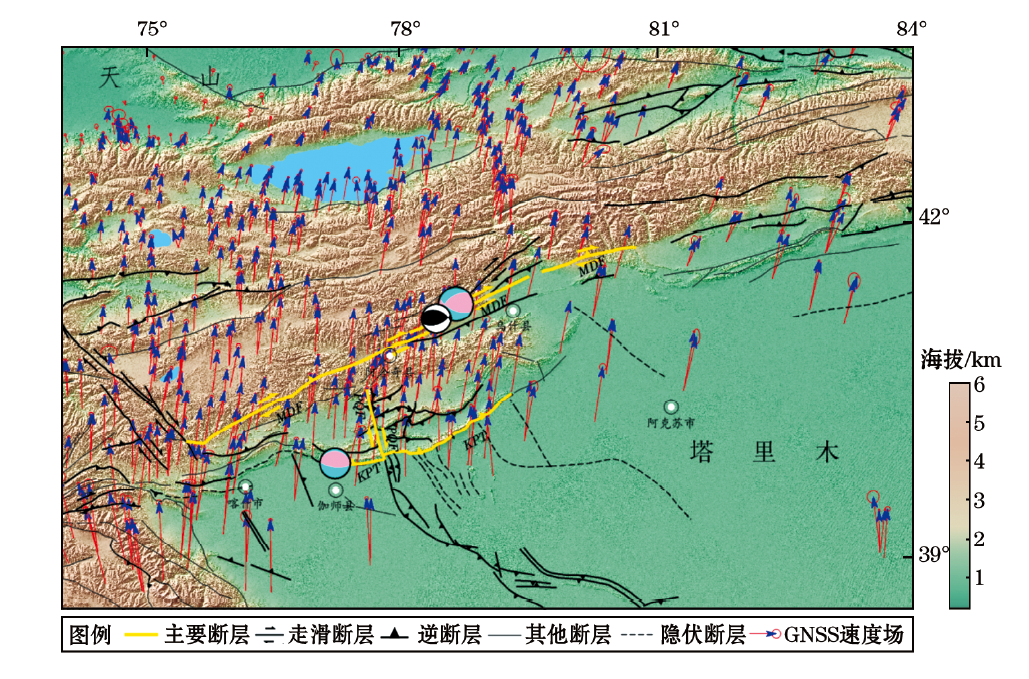
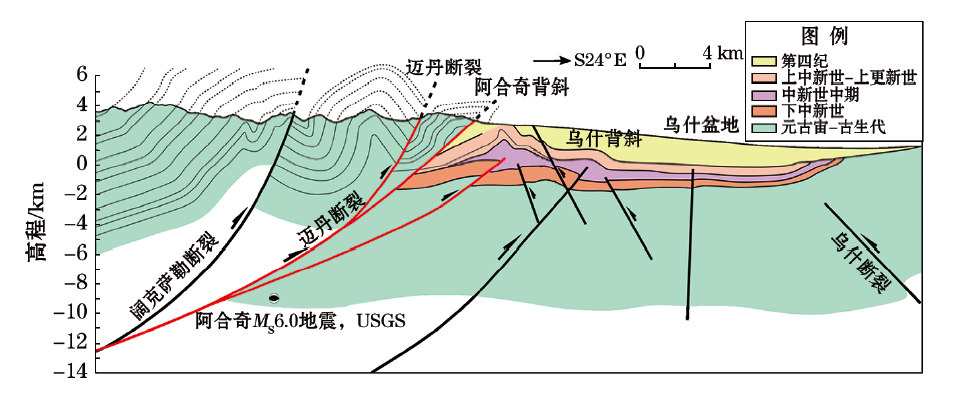
Taking 2025 Aheqi MS6.0 earthquake as the research object, combined with multi-source data such as regional geology, aftershock sequence, GNSS observation and source parameters, the seismogenic structure and regional crustal deformation characteristics of the earthquake were systematically analyzed by means of grid strain analysis, baseline time series tracking and Coulomb stress calculation. The seismogenic structure of the Akqi earthquake is the Maidan fault, which is a thrust and strike-slip rupture occurred after the long-term accumulation of regional tectonic strain under the background of the northward compression of the Indian plate. The strain analysis shows that the region has been in a north-south tectonic compression state for a long time. There is a significant shear strain concentration before the earthquake, and the strain generally attenuates after the earthquake. The baseline time series shows that the regional crust has a continuous north-south shortening, and the earthquake triggered a short-term disturbance. The Coulomb stress calculation shows that there is significant stress unloading in the source area, and secondary stress loading occurs in the surrounding Maidan fault and Wushi fault. The earthquake was triggered by the static Coulomb stress of the Wushi MS7.1 earthquake in 2024, reflecting the stress transfer between the regional fault systems. The seismogenic structure and dynamic causes of the Aheqi earthquake are clarified, which provides a scientific reference for seismic risk assessment and disaster prevention and mitigation in the southwestern Tianshan Mountains.